In the following example, we first analyze the number of log levels displayed in a .LOG file using a pie chart. We then see how to refine the connector configuration to display more relevant data.
This section implies that you are familiar with the Mashup Builder and Administration Console components.
Step 1: Analyze Log Levels
1. We want to analyze a .LOG file: configure your connector with the log4j line format.
2. We want to display a pie chart sorted on log levels:
a. In the Administration Console, set the log level as category facet in your data model.
b. In the Mashup Builder, configure a pie chart based on the facet defined previously in your search page.
3. Reindex.
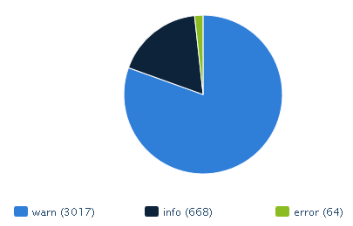
You get the following pie chart on your search page:
Many errors appear. Let us see how we can refine our analysis.
With our current connector configuration, each row containing [error] is analyzed as an error. In this example, we have in fact one single error followed by the details of the exception.
1. We must configure our connector to ignore the stack trace: in your connector configuration, select Group on for the following fields:
◦ date
◦ level
◦ thread
◦ logger
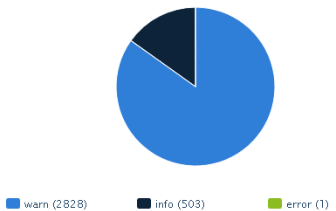
2. Reindex.
You get the following pie chart on your search page: