Mashup Builder and particularly its premium version comes with many widgets grouped by type. This section focuses on three widgets, the Result Table, Pie Chart and Stacked Column Chart widgets. You will find examples using other widgets throughout this guide.
Note: Most chart widgets come from the highcharts and highstock libraries, we recommend reading their documentation on http://www.highcharts.com/ for advanced configuration (in the Javascript tab of the chart widget properties).
Add a Result Table widget
This example shows how to display results in a Result Table widget, and set it to refine document search.
1. In Mashup Builder, go to the search page and select the Design view.
2. In the Widgets panel, expand the Results Rendering group, and drag the Result Table widget just above the Result List widget.
3. Click the Result table widget header.
The widget properties panel opens at the bottom of the screen.
4. On the Hit Config tab:
a. For Hit title, select Hit Metas > title from the Values contextual menu on the left.
You will get ${entry.metas['title']}
b. For Hit URL, select Hit Metas > url from the Values contextual menu on the left.
You will get ${entry.metas['url']!uh}
5. On the Hits metas tab, deselect Display metas.
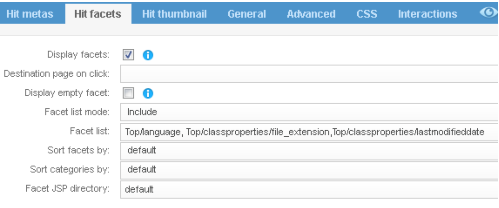
6. On the Hit facets tab, set the list of facets to include as columns in the table. For example, we want to get three columns displaying the File extension, the language, and the last modification of each document.
a. For Facet list mode, select include.
b. In the Facet List field that displays, select the facets to include in the Result Table, using the Values contextual menu on the left. These must be separated by commas. For example: Top/language, Top/classproperties/file_extension,Top/classproperties/lastmodifieddate
7. Select the Preview to check your configuration changes.
8. Click Apply.
To see your changes, go to http://<HOSTNAME>:<BASEPORT+1>/mashup-builder.
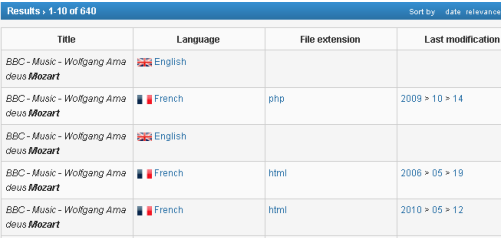
Your Mashup UI application should now have a search result page with a Result Table above the standard result list. You can use this table to refine your document search.
Add a Pie Chart widget
In this example, we will add a Pie Chart widget to refine on result segments.
This example is based on the set of documents located under the <INSTALLDIR>/docs/ directory.
Figure 5. Example of Mashup UI application with Result Table
This widget is available in Mashup Builder Premium only.
1. In Mashup Builder, go to the index page and select the Design view.
2. In the Widgets panel, expand the Visualizations > Charts group, and drag the Pie Chart widget to the last row of the canvas.
3. Click the Pie Chart widget header.
The widget properties panel opens at the bottom of the screen.
4. From the General tab, set up the pie chart to launch a search with the corresponding refinement when you click a slice of the pie.
a. Enter a Widget title, for example Document Types.
b. In Facet, select the facet to refine on from the Values contextual menu on the left, for example Top/classproperties/file_extension to refine on document file extensions.
5. From the Advanced tab, set the search page as the page that will display the result corresponding to the slice selected on the pie chart.
a. In Destination page on click select search.
b. In Max number of categories, increase the default number if there are more than 5 categories (for example, 7). This is to avoid having an Other category gathering all the categories that will not be displayed with the default value.
6. If you want to customize the colors used by the pie chart, go to the JavaScript tab and specify the HTML hexadecimal codes of your favorite colors.
a. Uncomment the colors line by removing /* and */
b. Specify your favorite colors. For example, for the 7 categories we can define the following HTML colors: colors: ['#058DC7', '#50B432', '#ED561B', '#FF9900', '#CC33CC', '#660099', '#FF00FF']
7. Select the Preview to check your configuration changes.
8. Click Apply.
To see your changes, go to http://<HOSTNAME>:<BASEPORT+1>/mashup-builder.
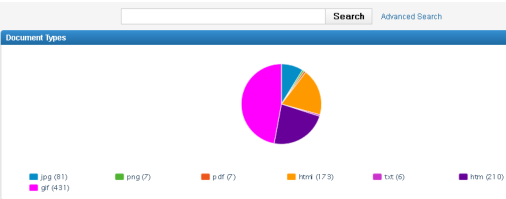
Your Mashup UI application should now have a Home (index) page that resembles the following screenshot.
Figure 6. Example of Mashup UI application with integrated pie chart.
You can refine your search by selecting a pie chart section, and view its related results only.
Add a Stacked Column Chart
This section gives several examples of Stacked Column Chart widget configuration:
• display multiple dimension in stacked bars
• display both bars and lines
• remove legends
• add labels to the chart axes
This widget is available in Mashup Builder Premium only.
Display multiple dimensions in stacked bars
This example is based on the sales sample database located under the <INSTALLDIR>/docs/sample_database directory.
We assume you have followed the “Connect to the database” and “Create a new class in the data model” sections of the CloudView Getting Started Guide.
1. In the Administration Console, go to Search Logics > Facets.
2. Click Add facet and:
a. For Name, enter multidim
b. For Type, select Multi-dimension.
c. Click Accept.
3. Add two dimensions to the multidim facet.
Facet
Sort by
store_city
Count
category
Count
4. Click Apply.
5. In Mashup Builder, drag the Stacked Column Chart widget on a page.
6. Click the widget header.
The widget properties panel opens at the bottom of the screen.
7. On the General tab:
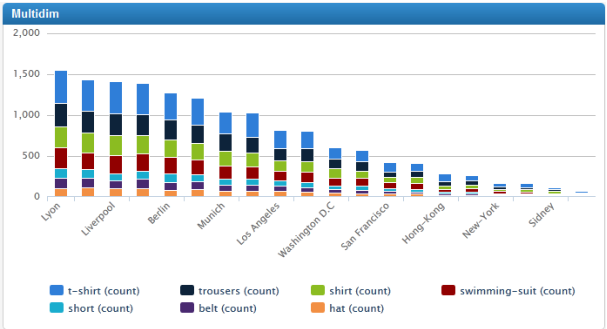
a. For Widget title, enter Multidim.
b. For Facet type, select multi_dimension.
c. For X, select multidim from the Values contextual menu on the left.
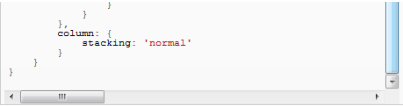
8. Go to the JavaScript tab and uncomment the /*stacking: 'normal'*/ line, to get stacking: 'normal'
Note: Press F11 to switch the code editor to fullscreen mode
9. Click Apply.
To see your changes, go to http://<HOSTNAME>:<BASEPORT+1>/mashup-builder.
Your Mashup Builder application should now have a Chart that resembles the following screenshot.
Figure 7. Display of multiple dimensions in stacked bar
Display both bars and lines
This example is based on the set of documents located under the <INSTALLDIR>/docs/ directory
1. In the Administration Console, go to Search Logics > Facets.
2. Expand the file_extension facet and define the following aggregations:
Id
Type
Expression
file_size_avg
AVG
document_file_size
file_size_min
Min
document_file_size
file_size_max
Max
document_file_size
3. Click Apply.
4. In Mashup Builder, select a page and then select the Design view.
5. In the Widgets panel, select Visualizations > Charts, and drag the Stacked Column Chart widget on your page.
6. Click the widget header.
The widget properties panel opens at the bottom of the screen.
7. On the General tab:
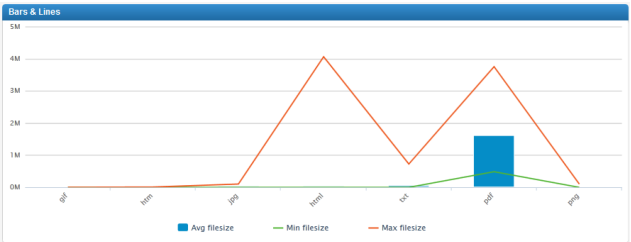
a. For Widget title, enter Bars & Lines.
b. For X, select file_extension from the Values contextual menu on the left .
c. For Y , create the following series:
Aggregation
Series type
Legend
file_size_avg
column
Avg file size
file_size_min
line
Min file size
file_size_max
line
Max file size
8. Select the Preview to check your configuration changes.
9. Click Apply.
To see your changes, go to http://<HOSTNAME>:<BASEPORT+1>/mashup-builder.
Your Mashup Builder application should now have a Chart that resembles the following screenshot.
Figure 8. Display of bars and lines in Stacked Column Chart widget
Remove the chart legend
This example is based on the set of documents located under the <INSTALLDIR>/docs/ directory.
1. In Mashup Builder, drag the Stacked Column Chart widget on a page.
2. Click the widget header.
The widget properties panel opens at the bottom of the screen.
3. On the General tab:
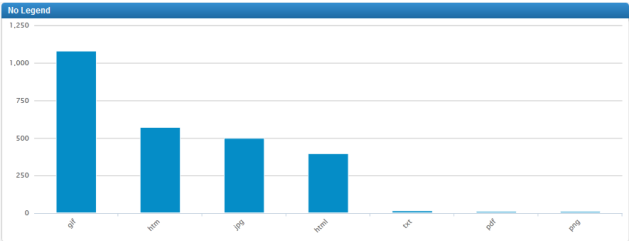
a. For Widget title, enter No Legend.
b. For Facet type, select normal.
c. For X, select file_extension from the Values contextual menu on the left.
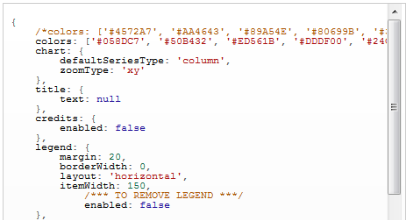
4. Go to the JavaScript tab and in the legend node, set the enabled attribute to false.
5. Select the Preview to check your configuration changes.
6. Click Apply.
To see your changes, go to http://<HOSTNAME>:<BASEPORT+1>/mashup-builder.
Your Mashup Builder application should now have a Chart without legend, as shown in the following screenshot.
Figure 9. Chart without legend
Add labels to the chart axes
This example is based on the set of documents located under the <INSTALLDIR>/docs/ directory.
1. In Mashup Builder, drag the Stacked Column Chart widget on a page.
2. Click the widget header.
The widget properties panel opens at the bottom of the screen.
3. On the General tab:
a. For Widget title, enter Labels on axes.
b. For Facet type, select normal.
c. For X, select file_extension from the Values contextual menu on the left.
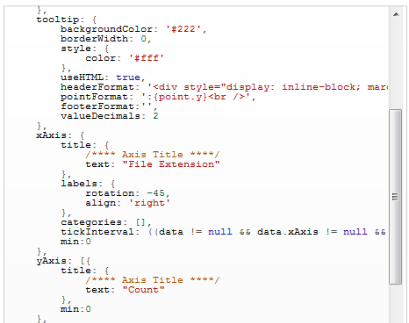
4. Go to the JavaScript tab and enter the labels of your choice for the text attributes of the xAxis and yAxis nodes.
5. Select the Preview to check your configuration changes.
6. Click Apply.
To see your changes, go to http://<HOSTNAME>:<BASEPORT+1>/mashup-builder.
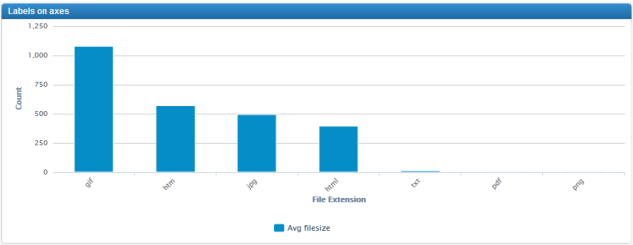
Your Mashup Builder application should now have a Chart with labels on axes, as shown in the following screenshot example.
Figure 10. Chart with labels on axes
Specify widget interactions
Widget interactions allows certain widgets to interact with one another, for example, Result List, Google Map, Bookmarks etc. All these widgets contain an Interactions tab in their properties panel.
This feature provides:
• a list of widgets on which you can create interactions.
• a field to specify the name of the widget that must be linked to the current widget, in exa.io.<property name> fields.
The following use case shows how to create a form with widget interactions. In this example we want to restrict the search results with two input widgets: one to select an author and one to select a start date using a datepicker. The aim is to link the input widgets to the Standard Search Form widget so as to submit the form with its Search button. The results will be filtered according to the selected author and start date.
1. In Mashup Builder, select a page, for example /search, and select the Design view.
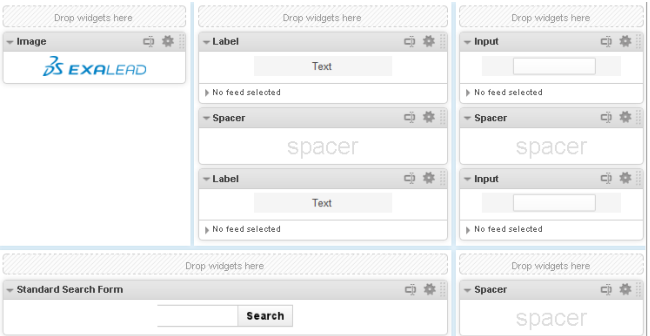
2. From the Widgets panel, drag and drop widgets to assemble your form.
In our example, we add a set of Label and Input widgets to create a form, as represented in the following table and screenshots.
Row #
Label Widget
Input Widget
1
Text: Author
Name: author, Type: text
Interactions: Standard Search Form
2
Text: Start Date
Name: startdate, Type: datepicker
Interactions: Standard Search Form
3. Select the Preview to check your configuration changes.
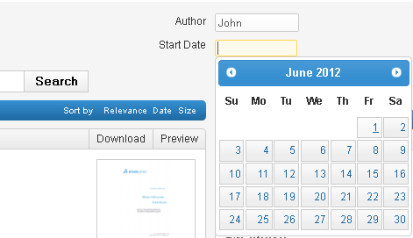
You should see the form on your Mashup Builder page, and be able to complete it.
4. Click Apply.
Figure 11. Form inputs linked to the Search button of the Standard Search Form