In your Mashup UI applications you typically use facets through the Refinements panel. By refining your query on a specific facet, you narrow the number of hits displayed in the search results.
Facets are also displayed in charts and table widgets, where you can refine the view by selecting values. For example, in a chart displaying a document count by month, you can focus on the values of a specific month.
Index-Time and Search-Time Facets
Exalead CloudView has 2 notions of facets:
• Index-time facets, stored as hierarchical categories in the category field of the index. These index-time facets are often referred to as category facets. They are typically used for alphanumeric metas. After creating index-time facets, you must reindex to store the resulting categories in the category field. In turn, these hierarchal categories display as facets in your search application.
• Search-time facets, also known as virtual facets. They are based on index fields stored in RAM, and are typically used for dates and numbers. A big advantage of search-time facets is they are available as soon as you create them; you do not need to reindex.
Which Facet Type Should I Use?
The following table explains which type of facet to create, depending on what you want to display in your application. In each section is a cross-reference for learning more about that particular facet type.
Facet Types
To display the following
Use this facet type
Dates
Choose from the following Date facets:
• Date: provides fine-grain control on date sorting.
• Dynamic dates: Automatically adjusts date granularity, depending on the maximum number of categories specified, and the date range of the search results.
Multiple facets, typically to display in tables, charts, or pivot tables
Choose from the following Multidimension facets:
• Multi-dimension: Based on N single-dimension facets, and generates a grid, with one facet per dimension. Each cell contains the number of documents and aggregation values for each of the N single-dimension facets. Displays only one level at time, which means better facet performance compared to Hierarchical2D.
• Hierarchical2D: Based on two single-dimension facets for each axis. Displays all levels in the hierarchy at once. Use for multiple timelines.
Ranged values, such as prices ($0-100, $101-200...)
Numerical ranges are virtual numerical facets used to organize search results in ranges. Specify how to create these ranges:
• automatically: to specify the number of ranges only, and leave Exalead CloudView define ranges based on search results automatically.
• that are the same size: to define a fixed size for all ranges. For example, a range of 100 creates the ranges 0-100, 101-200.
• manually: to define everything, that is, the number of ranges, their max and min values, and the range title to display in the Refinements panel.
Geographic data, either rasters or vectors
Choose from the following Geographic facets:
• Auto-tile geographic: Use for rasters. It creates geographic facets based on a bounding box. Must be based on a XY or GPS point Data Model property.
• Geographic: Use for vectors. It creates geographic facets based on disks or polygons. Must be based on a XY or GPS point Data Model property.
Alphanumeric metas with hierarchical values
Category: Use this type of facet if you want to display hierarchical values, or want to define meta mappings to a category manually, instead of using Data Model properties.
This type of facet resides in the index, under the category field in the format. It is the only facet type that requires reindexing to be available in your application.
Alphanumeric metas with nonhierarchical values, such as a list of countries, or file formats
Value: Use this instead of a Category facet. It is saved under the value field, which is optimized for faster faceting.
Only use for nonhierarchical metas. Create this facet on a value type index field.
Concept of Category Facet
All facet types output as a tree made up of facet value objects, called "Category".
In addition, in the data model, when a property is defined as a category facet, such a facet is always created from the values of the properties. For more information about properties, see Using Properties to Configure Document Metas.
Even facets created for numerical data model properties, are always category facets. This means that each value of the property creates a category.
Create Facets
Create Facets Using the Data Model
This procedure applies to category facets only. Facets created by the data model are available as Top/ClassProperties/Property_name.
1. In the Administration Console, go to Index > Data model.
2. (Optional) Under Classes, click Add class and specify a new class.
3. Under Properties for the <class name>, you can either:
◦ modify an existing property by selecting the Category facet option,
◦ create a new property and select the Category facet option.
4. (Optional) Change the default configuration.
For more information, see the "Datamodel" section of the CloudView XML Configuration Reference Guide.
5. Click Apply.
6. On the Administration ConsoleHome page, scan your data source.
The next time you search your index, this facet is included in the results.
Create Facets in the Search Logic
This procedure applies to both category (index-time) and virtual (search-time) facets.
1. In the Administration Console, go to Search > Search Logics > Facets.
2. Click Add facets.
a. Specify a Name
b. Select a Type.
c. Click Accept.
3. Configure according to the facet type.
For more information, select the section corresponding to the facet type from the related topics panel above. See also the "Search" section of the CloudView XML Configuration Reference Guide.
4. Click Apply.
The next time you search your index, this facet is included in the results.
Create Facets Dynamically Using the Search API
You can also declare facets dynamically at query-time, on a per-query basis.
Virtual numerical facets are used to organize search results in ranges.
Unlike category facets, the values created by a virtual numerical facet do not have a hierarchy. They are, however, attached to a "virtual root", which is a category path under which the virtual categories are created.
The computation is based on a virtual field expression, which allows you to categorize based on any calculation supported by the virtual expression syntax.
You then need to specify how you want to create these ranges.
Create Ranges Automatically
When facet ranges are created automatically, they generate ranges across the results of the query. However, this feature can be costly in terms of memory consumption.
The following range-generation policies are available:
• Linear
• Geometric
Linear Range Policy
A linear range policy defines ranges so each range includes a similar number of documents. The Max number of ranges option defines the number of ranges to generate and the parameter policy defines which policy must be applied.
For example, for these search results:
• 10 documents that each contain 1
• 9 documents that each contain 2,3,4,..,10
With the following configuration:
• Range generation policy: linear
• Max. number of ranges: 2
Displays the dynamic range facets as follows:
Top/ dynamic2/ 19 [1;1] 10 [2;10] 9
Geometric Range Policy
A geometric range policy accepts the same parameters as linear, except that each range contains twice as many documents as the range that follows.
Create Ranges That Are the Same Size
In this variant, a fixed range size is given, and a facet value is created for multiples of this range. For example, create a facet on price with a range size of 100 creates the following facet values:
• 0-100
• 101-200
• 201-300
Create Ranges Manually
In this variant, you can manually specify the ranges. Each range receives a title, which is the value of the category.
Range boundaries are inclusive, therefore, if you have 2 ranges [0;1] and [1;2], 1 is in both ranges.
For example, we can define an explicit range facet on the expression:
#now() - last_modified_date, with the following ranges:
min=0, max=86400*7 --> title = "Modified last week"
min=86400*7, max=86400*31 --> title = "Modified last 30 days"
Date Facets
Date faceting is used to:
• Create a Top/myDate/YYYY/MM/DD category hierarchy at indexing time. This is a category date facet.
• Apply a CategorySynthesis to Top/myDate at search time. This is a virtual date facet, of which there are the following types:
◦ Dynamic date: adapts dynamically to the chosen date range, so dates can display as years for multiyear date ranges, but as month/year or day/month/year for shorter date ranges. This is useful for displaying large date ranges in widgets. See Control Date Display with Dynamic Date Facets.
Advantage of Virtual Date Facets
Using virtual date faceting saves on index, while providing greater flexibility.
For example, let us say that each document has a date/time of:
2013/05/12 15:05:12
Before virtual date faceting, date synthesis required that the analysis preprocess all dates and create a category per year, month, and day for them, as well as one per hour, minute, second if time synthesis was required.
Now, with virtual faceting, no specific analysis is required. In your search logic, you can define which categories to create. For example, for year and month faceting, create a DateFacet with withYear and withMonth set to true, and all others set to false.
Synthesis can be enabled independently for year, month, week, day, hour, minute, and second.
Note: DateFacets refinements behave differently for full dates (such as Year/month or Year/month/day/hour) than for other date-time combinations (such as Year/hour).
• For full dates, refinements are done efficiently with a numerical search.
• For other date-time combinations, refinements are done with a less efficient attrnum query.
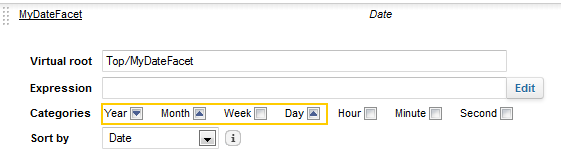
Control Sorting with Static Date Facets
When sorting date facets by date, you can control the sort on a category by category basis.
For example, by default a date facet sorts categories by:
• years in descending order
• months in ascending order
• days in ascending order
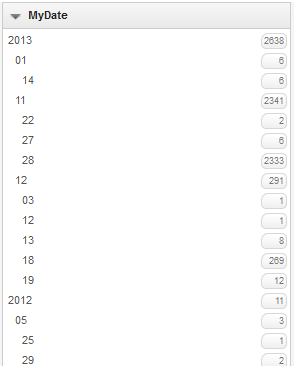
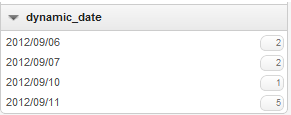
In the Mashup UI’s Refinement panel, the date facets are displayed like this:
However, you can change this by changing the arrows for each category in the facet. In the following example, years, months, and days are displayed in ascending order.
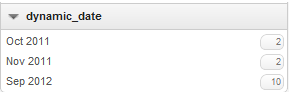
Control Date Display with Dynamic Date Facets
Use Dynamic Date facets to:
• Drill down in the Refinements panel. Depending on the date granularity you selected for the facet, you can drill from year to month, or from month to days. By contrast, static Date facets display all levels in a hierarchy.
Figure 15. Dynamic Date Facets Allow You to Drill down in the Refinements Panel
• Control how many date values display in widgets.
Widgets have a limited width, which makes it hard to display large date ranges in a legible way. Dynamic date facets solve this by choosing a granularity that displays the most date values possible for the date range, without exceeding the maximum date values allowed. By default, this maximum is 40 but you can change it.
For example, if the search results included 1-year worth of documents, the facet initially displays 12 months. It uses a month granularity because displaying four quarters does not take full advantage of the number of date values allowed (40 by default), while displaying 52 weeks exceeds it.
However, if search results only included 2 weeks’ worth of documents, the facet adapts to the shorter period by initially displaying 14 days.
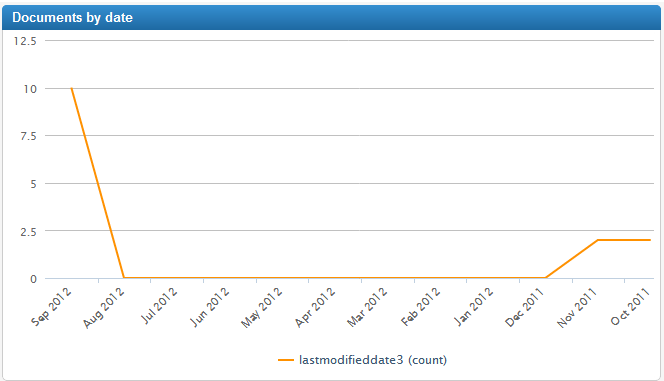
• Fill in missing dates with null values, which is useful for time-series widgets.
If some documents are missing dates, there is an option to generate missing dates automatically, with a count of 0 and an aggregation value of NO_VALUE.
Note: You can only generate missing dates when sorting the dynamic date facets by date. The auto-generated dates do not display in the Refinements panel, but they do display in Mashup Builder chart widgets.
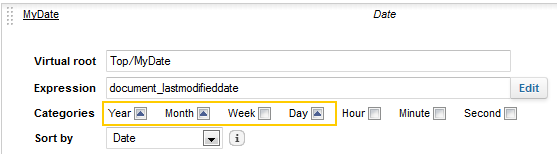
Configure Date Facets
Define Dynamic Date Facets
Dynamic date facets automatically adjust the granularity of the date display, according to the maximum number of facet values specified, and the date range for your search results.
1. Follow the steps to create a new facet, selecting Dynamic date for the Type field. For details, see Create Facets in the Search Logic.
2. For Expression, define an expression based on a RAM-based index field for this facet.
3. For Units, select the granularity you want to be able to display. For example, select Year, Month and Day.
4. (Optional) In Max. categories, change how many date values this facet can display. By default this is 40.
The lower this number, the more likely dates display at a lower granularity (years instead of months, or weeks instead of days). Displaying lower-granularity dates is useful when representing large date ranges in widgets.
5. Select Enable ISO 8601 compliance, to get weeks starting on Monday and a few rules determining the first and last week of each year. Use compatible Output formats. Typically, use %V instead of %U otherwise week numbering is not consistent with grouping.
6. Click Apply.
7. In the Mashup UI, perform a search that returns a date range that spans several months or weeks.
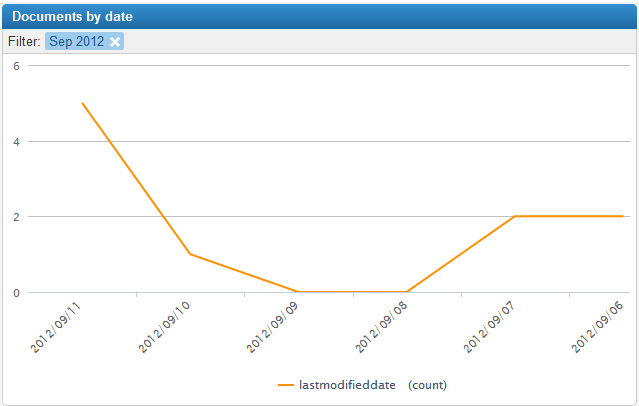
As you refine on these search results, the dynamic date facet display on the Refinement panel. For an example of how dates adjust when displayed in a chart, see Generate Missing Dates, Step 8 and Step 9.
Generate Missing Dates
1. In the dynamic date facet setup options, for Sort by check that Date is selected.
2. Select Generate missing intervals, if not already selected.
3. Click Apply.
4. In Mashup Builder, add a line chart widget to your /search page:
a. Go to the search page and select the Design view
b. In the Widgets panel, expand Visualizations > Charts, and drag the Line Chart widget on to the page.
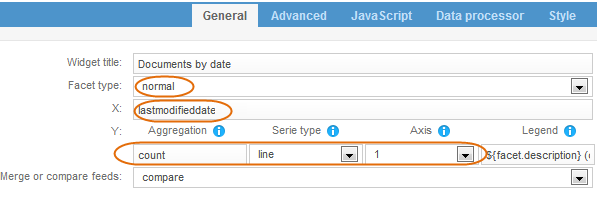
5. Click the header of the Line Chart widget to fill in the required properties:
a. For Facet type, select normal.
b. For X, select the dynamic date facet from the list at left. In our example, this is lastmodified date.
c. Under Aggregation, select count.
d. For Chart type, select line.
e. For Axis, select 1.
6. Click Preview to make sure that the chart looks as expected.
7. Click Apply.
8. In the Mashup UI, perform a search that returns a date range that you know includes some missing dates.
Note: While the chart widget displays auto-generated missing dates, the Refinement panels does not. It only displays facet dates that exist in the underlying index field.
9. Refine your search results to shorten the matching documents’ date range.
Change the Display Format for the Dates
The output format is defined using UNIX date syntax.
1. In the dynamic date facet setup options, expand Output formats.
Multi-Dimension facets and Hierarchical2D facets are different from the other facet types. They do not apply directly to expressions, but use the categories generated by two or more other facets (any type, virtual or not, but one-dimensional only) to create its own categories.
Multi-Dimension Facets
A MultiDimensionFacet takes the categories generated by N single-dimension facets, and generates a grid, with one facet per dimension as shown in the figure below. Each cell of the grid contains the number of documents and aggregation values that have a given category for each of the N one-dimension facets.
Important: When one of the two single-dimension facets used to build a Hierarchical 2D facet has no values (for example, when value facet F1 has /a/b/c categories, and value facet F2 has no categories), the Hierarchical 2D facet does not display any categories. To bypass this behavior, you can create default values for the empty facet. To do so, go to Data Model > Classes and for the empty category facet, enter the required value in the Default value field.
Hierarchical2D Facets
A Hierarchical2DFacets creates a two-dimension (or matrix) hierarchy of categories. They enable the calculating of pivot tables. They are based on two single-dimension facets for the two axes.
For example, if you have a country category and a sales index field, you can define:
• a category facet on country
• a ranged facet on the sales
• a Hierarchical2D facet on the previous two, which calculates a matrix of sales per country
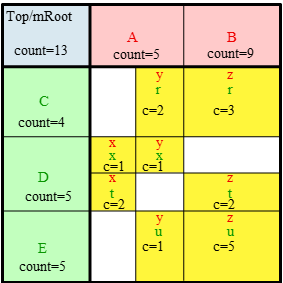
For example, let us consider a Hierarchical2DFacet, hier2d, that references facets id1 and id2.
Therefore hier2d generates the following 2D hierarchy:
Figure 17. Example of Hierarchical2D Facet
Important: When one of the two single-dimension facets used to build a Hierarchical facet has no values (for example, when value facet F1 has /a/b/c categories, and value facet F2 has no categories), the Hierarchical facet does not display any categories. To bypass this behavior, you must create default values for the empty facet. To do so, you can either use the Data Model > Classes > Default value field or use a Data Processing > Document Processors > Value Selector processor with a Does not exist condition to indicate that the given meta is empty .
Displaying Multidimension Facets in Mashup UI
Mashup Builder includes several widgets that support Multi-Dimension and Hierarchical2D facets, such as:
• 2D Table
• Stacked Column Chart
• Mutable Chart
• Timeline
For more information, see the Widget Reference.
Geographic Facets
You can create facets based on geographic points (both GPS and XY types). Like other facets, they automatically display a count of matching documents for each facet value.
You can also aggregate document values that fall within one or several geographic areas.
You can define the following types of geographic facets:
• To return matches within a specified disk or polygon, create a Geographic facet. Use this facet when you know where to focus your search. You can define multiple disks or polygons for a facet. Each disk or polygon represents a facet value.
• To highlight areas containing matches within a bounding box, create an Auto-tile geographic facet. Use this facet when you want to locate areas containing matches (known as tiles) within a larger area.
By default, this bounding box (or the extent) is the entire globe, but you can modify this. Each tile represents a facet value.
Create Facets Based on Disks or Polygons
1. In the Administration Console, go to Search > Search Logics > Facets.
2. Click Add facet, specify a name, and select the Geographic type.
3. In Index field, select a geographic field from the list.
4. In Domains, for Type select the shape of the area, that is to say Disk or Polygon and specify the area’s extent.
The coordinates depend on whether the facet is based on a GPS or XY point index field:
◦ For a disk: specify a center point and a radius.
◦ For a polygon: specify a list of coordinates, separated by semicolumns. Two successive points must be connected by an edge, and the polygon is automatically closed (an edge is added between the last and first point).
Important: The time required for facet synthesis is directly proportional to the number of points in the polygon.
5. (Optional) Add another disk or polygon area. You can mix polygons and disks within the same facet, and the areas can overlap.
6. (Optional) Expand Aggregation to create a summary on an index field for this facet.
7. Click Apply.
For an example (created in the XML configuration file, rather than in the Administration Console), see below.
Example 1. Example
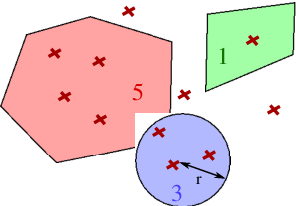
This example uses an ExplicitGeoFacet with one DiskDomain (blue) and two PolygonDomains (red and green), as shown in the figure below.
Figure 18. Example of an ExplicitGeoFacet with One DiskDomain (Blue) and Two PolygonDomains (Red and Green).
In this example, dark red crosses represent indexed points for each document. The red and blue domains overlap, which is allowed, and the point that falls within the intersection counts once for each domain.
Five points fall into the red polygon domain, three into the disk, and one into the green polygon domain. Three points fall outside all domains, and so are not counted in the results.
Create Facets Based on a Bounding Box
1. In the Administration Console, go to Search > Search Logics > Facets,
2. Click Add facet, specify a name, and select an Auto-tilegeographic type.
3. In Index field,select a geographic field from the list.
4. By default, the bounding box is the entire globe. If you want to change this, the coordinates depend on whether the facet is based on a GPS or XY point index field:
a. Bounding box min: define the lower left limit.
b. Bounding box max: define the upper right limit.
c. Tile size: specify the size of the area to highlight when there is a matching point on the map.
5. (Optional) Expand Aggregation to create a summary on an index field for this facet.
6. Click Apply.
Display Geographic Facets in a Map Widget
1. In Mashup Builder, drag a Google Maps widget onto your page.
2. Select a feed for your widget.
3. In the widget properties, go to the Based on Geo Facets tab.
a. In Geo facets list, click inside the field, then select your geographic facets from the panel on the left.
b. In Aggregation, click inside the field, then expand Aggregation from the panel on the left. From the list, select an aggregation. The higher this value, the darker the tile appears on the map.
4. Click Apply.
Create Value Facets for Nonhierarchical Metas
You can use value facets instead of category facets for alphanumeric metas that are not hierarchical and do not need to be tokenized. For example a list of countries, or file formats.
Value facets are saved under the value field, which is optimized for faster faceting.
Create a Value Facet Using the Data Model
1. In the Administration Console, go to Index > Data Model.
2. Select the appropriate class, and then click Add property.
◦ Data type: Alphanum
◦ Semantic type: accept the default, since no semantic processing is applied on a value field.
◦ Field type: Dedicated field and facet
3. In the settings for this property, expand Other advanced options, and select Enumerated.
4. Click Apply.
The next time you scan the corresponding data source for this property, Exalead CloudView creates a value field for this property in the index, as well as a value facet in the search logic.
Create a Value Facet Using the Index Advanced Schema
1. In the Administration Console, go to Index > Data Model > Advanced Schema tab.
2. Click Add field. For Type, select Value.
3. Configure the field’s options as required.
4. Click Apply.
The next time you scan the corresponding data source for this property, Exalead CloudView creates a value field for this property in the index, as well as a value facet in the search logic.
Create Aggregations for Facets
All facet types allow you to calculate aggregations for each value of the facet.
You can define an aggregation by:
• A virtual field expression defining the value to use for each hit.
• A function to create the aggregated value.
For example, if you have a facet based on the "country" of a sale, you can add an aggregation, on the price * quantity expression, using the "SUM" aggregation function. For each country, you get the total revenue generated by the sales on this country.
Available Aggregation Functions for Facets
Function
Description
MIN
The minimum value of the expression for all documents in the facet value.
MAX
The maximum value the expression for all documents in the facet value.
SUM
The total of all values of the expression over all documents in the facet value.
AVG
The average value of the expression over all documents in the facet value.
STDDEV
The standard deviation of all values of the expression for all documents in the facet value.
CENTILE(x)
Computes Nth percentile of the expression for all documents in the facet value, where N is a double between 0.0 and 100.0.
COUNT
The count of all documents that contain a value for the expression set in the facet value.
Note: Do not confuse it with the category document count.
MAXDATE
Computes the max date based on index time. You can specify output format in a custom expression using date formats (see Which Facet Type Should I Use?).
MINDATE
Computes the min date based on index time. You can specify output format in a custom expression using date formats (see Which Facet Type Should I Use?).
Most Mashup UI widgets that display facets can use aggregations, instead of the simple count of the facet value.
The results of aggregation functions on NULL values in the Search API follows these conventions:
• max(empty) = empty (that is, no value)
• avg(empty) = empty (that is, no value)
• sum(empty) = empty (that is, no value)
These values are returned as follows in the Access API (no values for unvalued aggregations):
The Refinement policy option specifies how search results are filtered when you select a facet value from the Refinements panel in a Mashup Builder application.
Exclusive Refinement
Exclusive is the standard refinement policy, it allows you to drill down on a single facet value, excluding all other values in the facet.
CategoryFacet(Top/Language, exclusive)
• Refines on the language/en facet.
• The result set only contains English documents.
• All other languages have disappeared from the navigation sidebar.
Disjunctive Refinement
Disjunctive refinement allows you to build a checkbox-based navigation. This navigation also allows you to drill down on a single facet value, while still displaying all other facet values on the Refinements panel.
Use this policy to refine on multiple facet values, which are combined using an OR operator when querying the index. To display check boxes next to each facet, select the Disjunctive facets option for the Standard Facets widget in Mashup Builder.
CategoryFacet(Top/Language, disjunctive)
• Refines on the language/en facet.
• The result set only contains English documents.
• All other languages are still included in the navigation sidebar, with counts on them. If you then refine on the language/fr facet, the result set contains both French and English documents.
Note that the HorizontalFacets widget displays only the first level of disjunctive facets.
No Refine
Use this when you need to group search results, but do not need to refine on them.